Reports: Auto-export / historical data
This time in HostBill release: new functionality added to HostBill Reports – now you can automatically snapshot report data from certain time period!
HostBill reports
HostBill allows you to generate various reports, either using pre-defined templates that can also be customized or optionally you can create your own reports based on your individual needs. Reports give you access to handful information from you HostBill, which can also be presented in a form of a widget on your admin dashboard.
New HostBill functionality allows to create snapshots: generate reports in a given time period and store them on a server and optionally send them to staff. Thanks to this option, you can get historical data, add it to admin area widgets and compare the results in time.
Creating report snapshots
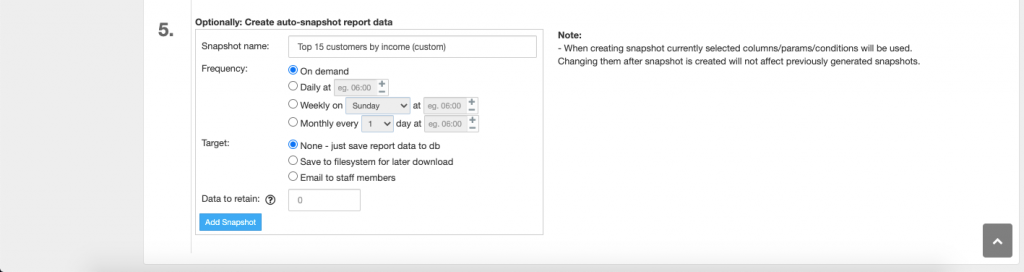
To snapshot report data, in the report details find and choose “Optionally: Auto-snapshot report data”. You can configure the snapshot and select its name, frequency – how often the report should be generated (on demand, daily, weekly, monthly), target – where the report should be generated (saved in database, saved to filesystem for later download or emailed to selected staff members) and data to retain – a number of auto-exports (for unlimited enter 0). One report can have unlimited number of snapshots. When creating snapshot currently selected columns/params/conditions will be used. Changing them after snapshot is created will not affect previously generated snapshots.
Additionally, when generating the report, you can choose the option “Generate report & store results” which will save the results as a snapshot with frequency on demand and unlimited data to retain, saved to filesystem.
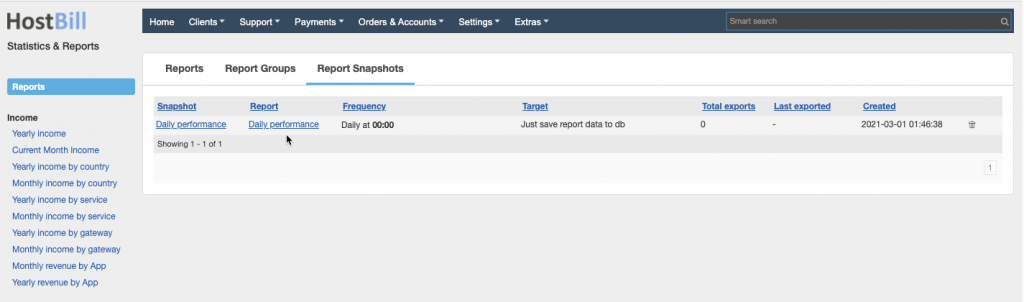
All automatically generated snapshots are listed in a new tab: Report Snapshots. In the listing you’ll find the snapshot details including the date when it was created, the date of the last export, and the number of exports created. Each snapshot here can be edited, you will also have the chance to manually generate the report with current values, download the attachments or delete given snapshot.
Reports widgets / series
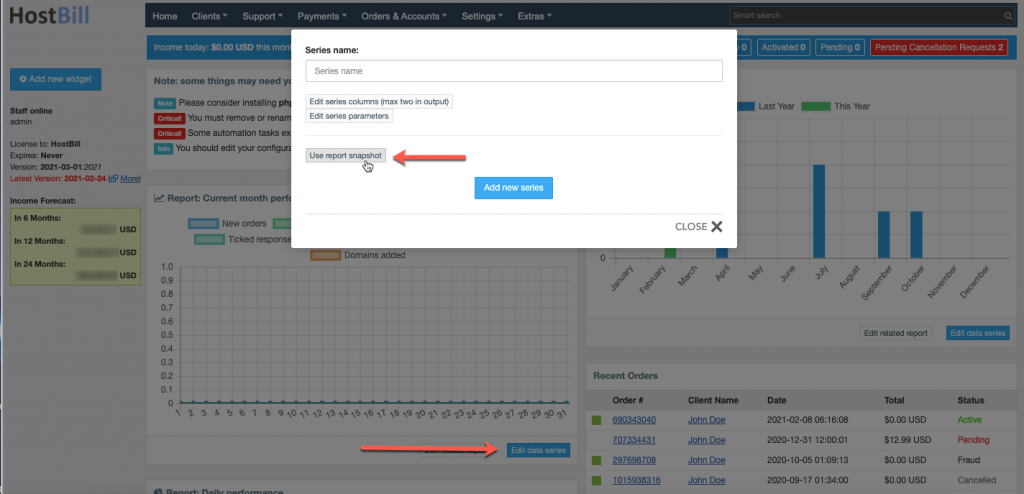
All reports from Statistics & Reports can be exported into Admin Dashboard Widgets in various forms (data table, pie chart, line graph, bar graph). When editing bar and line graphs you can add new data series to compare other data on single graph (more info in this video). Now, when adding new data series to the report, you can use snapshots instead of defining columns.